Hotel Revenue
In this project, I analyze hotel booking data between the years 2018–2020 acquired from Absent Data to figure out the revenue breakdown for several kinds of hotel characteristics. The data is analyzed in SQL (Microsoft SQL Server, and simultaneously in Google’s BigQuery) and visualized in Power BI through an interactive dashboard.
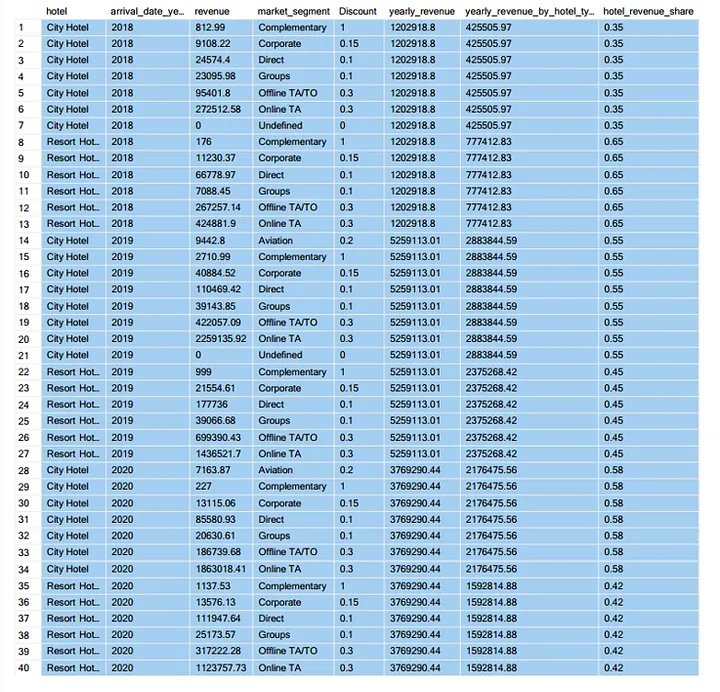
The revenue data was split between several sheets in an Excel Workbook that had to be imported to Microsoft SQL Server, appended and summarized. Further on, indicators such as yearly revenue, yearly revenue by hotel type and the latter’s percentage in the yearly revenue were created. The data is then broken down by hotel type, year, and market segment. Below you can see a snapshot of the data along with the SQL code.
The data clearly shows that yearly revenue is increasing in its first year. However, it soon drops off in 2020. Nevertheless, one caveat is that data for 2020 may not be complete and therefore not show the true change in revenue. As it pertains to revenue by hotel type, the data shows a mixed result in that resort hotels brought more revenue in 2018 than city hotels, but failed to do so in the subsequent years.
SQL Code for recreating the table above:
DROP TABLE IF EXISTS #sum_hotels; -- code to remedy iterative problems with temporary tables
WITH hotels AS( -- CTE to run before the main analysis so as to combine all the yearly tables
SELECT * FROM hotel_reservations.[dbo].[2018]
UNION
SELECT * FROM hotel_reservations.[dbo].[2019]
UNION
SELECT * FROM hotel_reservations.[dbo].[2020])
SELECT
hotel,
arrival_date_year,
ROUND(SUM((stays_in_week_nights + stays_in_weekend_nights)*adr*Discount),2) AS revenue,
hotels.market_segment,
Discount
INTO
#sum_hotels -- creating a temporary table so that we can use it later on for creating more variables inside of it
FROM
hotels
JOIN
hotel_reservations.[dbo].market_segment
ON
market_segment.market_segment = hotels.market_segment
GROUP BY
arrival_date_year,
hotel,
hotels.market_segment,
Discount
ORDER BY
hotel,
arrival_date_year,
market_segment;
SELECT
*,
ROUND(yearly_revenue_by_hotel_type/yearly_revenue,2) AS hotel_revenue_share
FROM
(SELECT
*,
SUM(revenue) OVER(PARTITION BY arrival_date_year) AS yearly_revenue,
SUM(revenue) OVER(PARTITION BY arrival_date_year, hotel) AS yearly_revenue_by_hotel_type
FROM
#sum_hotels) AS a -- the temporary table is used as a subquery that contains window variables that will be used to calculate indicators in the main query
ORDER BY
arrival_date_year,
hotel,
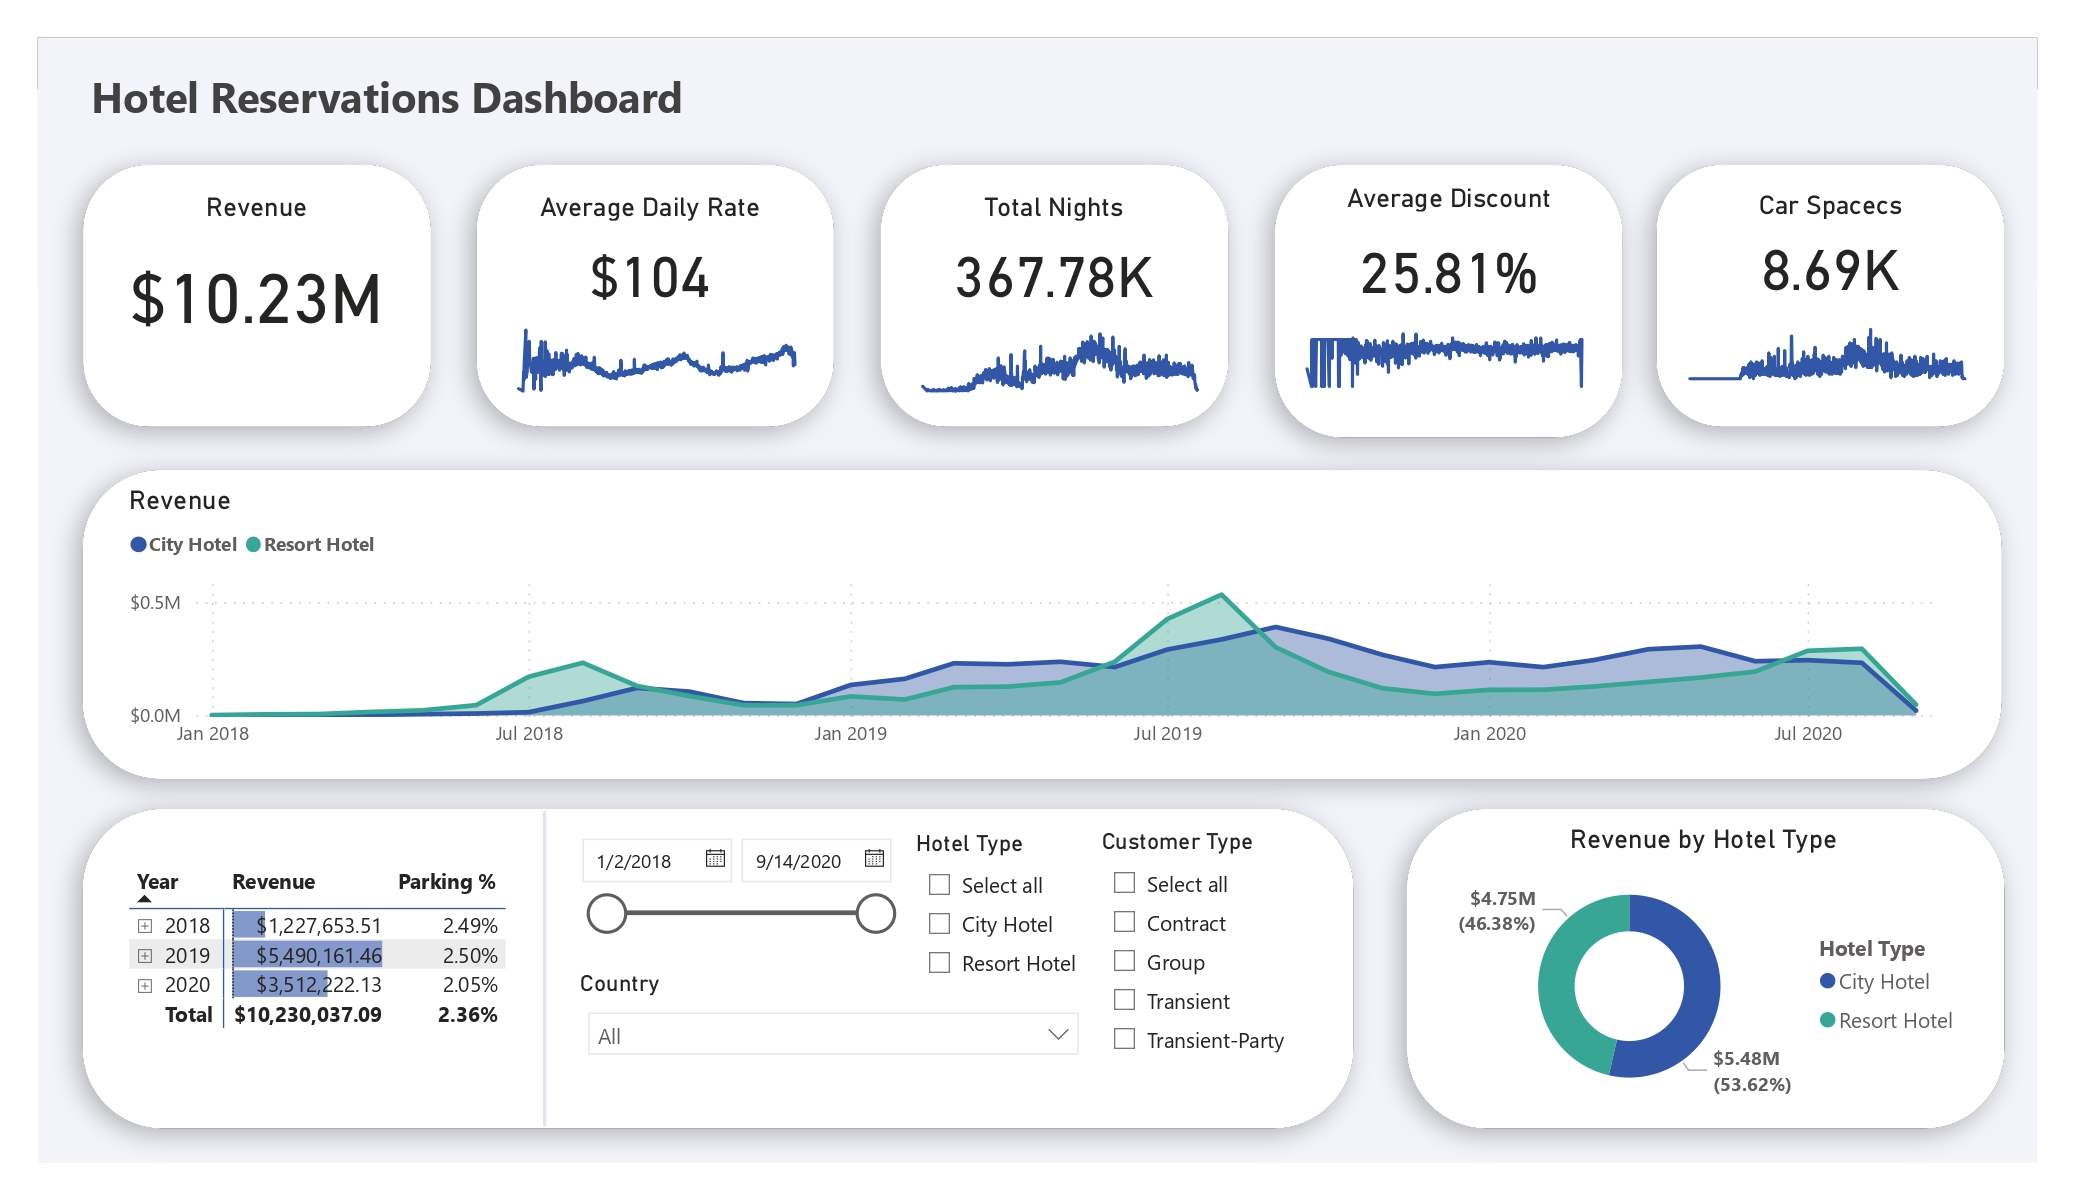
market_segment;Afterwards, the data was loaded in Microsoft Power BI where it was queried from SQL and visualized through a simple interactive dashboard. The dashboard shows several key indicators such as revenue, average daily rate at the hotels, the amount of total nights booked in the hotels, average discount, and total parking lot spaces. Additionally, historical revenue by hotel type is broken down by hotel type. Lastly, the data can be filtered via date and country of guests as well. An interesting insight is that car parking spaces shot up between 2018 and 2019 as a result of an increase in stays during that year.
This project and the alternate BigQuery source code can be found on my GitHub page.